The Map That Makes a Region Look Neater Than It Is
Learn how to read a news map’s boundaries, labels and omissions so you can see what its tidy outline includes—and what the story leaves outside.
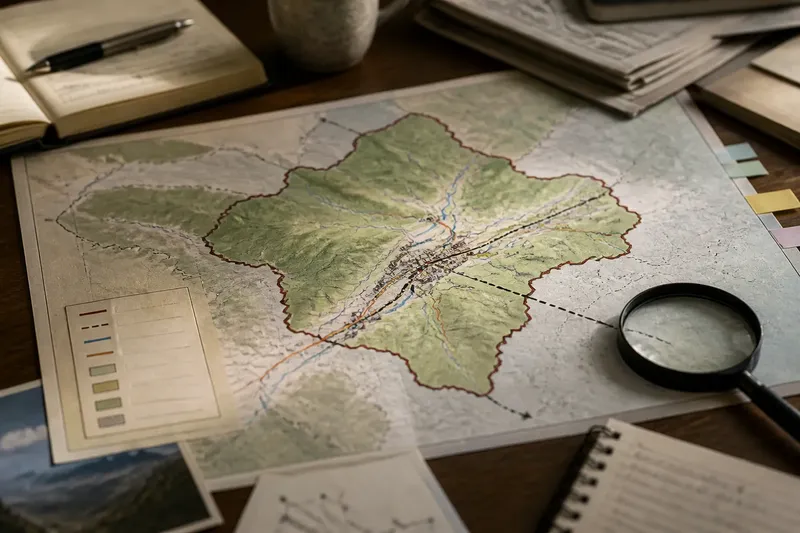
Why does a news map make a complicated region look like a tidy shape? Often, the outline is doing a particular job: locating a story, comparing areas or marking a boundary. Trouble starts when readers treat that useful simplification as a complete picture. To read a news map with care, ask what the map includes, where its edges came from and what falls beyond them.
When the outline feels definitive
A thick line around a region can look like a statement of fact, even when it marks only one chosen definition. A map might outline an administrative district, a disputed territory, a flood zone or an area named by the people involved. Those boundaries answer different questions. One is not automatically a substitute for another.
Look for the map’s title, legend and caption before interpreting the shape. A line labelled “district boundary” is not the same as a line showing where a language is commonly spoken. If the label is vague, such as “the region”, the map may be relying on a definition supplied elsewhere in the story. Find that explanation rather than assuming the outline is universally accepted.
Imagine a news story about a transport shutdown in a valley. Its map outlines the valley using a local administrative boundary, while the affected railway and nearby villages continue beyond it. A reader who treats the outline as the full area of disruption may miss those places. Checking the legend and tracing the route beyond the border makes the map’s purpose clearer.
When the edge hides connections
Maps have frames. A neat edge can separate the central place from roads, rivers, neighbourhoods or communities that shape what is happening there. This is especially easy to miss when the map shows a small area without a locator map or nearby place names.
Try moving outward in stages. First, identify the named place. Then look for the surrounding districts, transport links and physical features that might connect it to the story. If the map is interactive, zoom out; if it is printed, use a separate map only to orient yourself, not to replace the article’s evidence.
Notice whether the story discusses people or infrastructure just outside the border. A map of a city-centre protest, for instance, may omit the transit stations where crowds gathered or the suburbs from which participants travelled. The omission does not prove the map is misleading. It does show that its frame may be narrower than the story’s consequences.
When labels imply agreement
Place names and boundary labels can carry political or cultural meaning. A map may use one name where another is also common, or draw a contested line as if it were settled. Sometimes the cartographer has chosen a convention for clarity; sometimes the article explains a disagreement. The graphic alone may not tell you which.
Check the caption and surrounding text for phrases such as “claimed by”, “administered by” or “internationally recognised”. These describe different relationships. Do not turn a coloured area into a conclusion about sovereignty, identity or control unless the reporting supports that interpretation.
If several names appear, note who uses each one and in what context. The distinction may matter to the story, but it need not make the map unusable. Treat labels as clues about the map’s perspective, then compare them with the article’s account and the sources it names.
When colour looks like certainty
A shaded map can make gradual or uneven patterns appear sharply divided. A pale-to-dark scale might show population density, rainfall or reported incidents, while a single hard border can suggest that conditions change abruptly at the edge. The legend tells you what the colours encode; the map’s design tells you how visually dramatic those differences feel.
Check the units and categories. Does a colour represent a count, a rate, a forecast or a broad classification? Are blank areas genuinely without the mapped feature, or are they places with missing information? A blank patch is not self-explanatory. It may mean “not measured”, “not included” or simply “outside the selected dataset”.
Think of the outline like the rim of a serving plate: it helps organise what is shown, but it does not tell you everything about the meal. The analogy has limits, but it is a useful reminder that a boundary can be a design choice rather than a natural dividing line.
When the scale distorts distance
A map’s scale affects what can be seen. A regional map may make settlements look close together while hiding difficult terrain, poor transport links or long travel times. A detailed street map can show local routes but omit the wider geography that explains why a place matters.
Look for a scale bar, inset map and orientation marker. These help you judge distance and position, though they do not reveal every practical obstacle. If a news claim depends on how near two places are, check whether it means straight-line distance, road travel or access across a boundary.
Also notice projections. A flat map represents a curved surface, so some projections enlarge or compress areas and distances in particular ways. For a local story, this may not affect the central point. For a comparison across far-apart regions, the projection can change what looks prominent.
When the map’s date is missing
Boundaries, place names, roads and conditions can change. A map without a visible date may still be useful for orientation, but it is harder to know whether it represents the situation described in a developing story. Captions sometimes give a publication date without saying when the underlying map data were gathered.
Look for a source note, data date or update label. Then compare it with the article’s timeline. A map of an evacuation area, for example, might show an earlier boundary than the one described in a later update. That difference should prompt you to read the latest text, not to assume the graphic has changed along with it.
Questions readers ask?
How can I tell what a boundary means?
Read the legend and caption for the boundary’s stated purpose, such as an administrative area or a disputed line. If neither explains it, treat the outline as a design choice whose meaning remains unclear.
Does a blank area mean nothing is happening there?
No. It may mark missing data, an area outside the chosen frame or a place where the mapped feature was not recorded. Check the legend and source note before drawing a conclusion.
Why do two maps show different borders?
They may use different definitions, dates, sources or conventions. Compare their captions and intended purposes before deciding that one is simply wrong.
What should I do if a map seems to contradict the story?
Check whether the map and text refer to the same time, area and kind of boundary. If the mismatch remains, treat it as an unresolved inconsistency rather than choosing whichever version looks more convincing.
A reliable reading order
When a map feels too neat, work through it in this order: identify its subject, read the legend, check the boundary label, inspect the frame, look for date and source information, then compare the graphic with the story’s wording. Each check addresses a different source of confusion, so there is no need to guess what the cartographer intended.
For news maps, context often lives just outside the coloured shape: in a caption, a neighbouring place name, a date or a boundary definition. Read those details before treating the outline as the whole story. The map can still orient you; the useful question is what kind of orientation it offers.